A window into Windows performance
Operating systems monitor resources continuously in order to effectively schedule processes. However, surfacing that data for your own monitoring or analytics is not always easy. Fortunately, the Windows Server family of operating systems offer a wealth of operational data that you can access through a number of channels. To help make your Windows infrastructure observable, you need to track several types of data from Windows Server 2012:
Performance counters
Events
Services
A few notes about terminology: In this series, we use the term “Windows” to reference Windows Server 2012 R2 specifically, though many of the performance counters and events discussed in this series are available in other Windows Server versions. And we’ll characterize metrics as “work” or “resource” metrics—for background on this distinction, refer to our Monitoring 101 posts on metric collection and alerting.
Performance counters/metrics
Windows exposes a huge number of metrics (more than 15,000 on a fresh install) as so-called performance counters. Key performance counters can be divided into four groups:
CPU
Memory
Disk
Network
The lists provided below provide a good foundation to get started monitoring Windows Server, no matter if your box is a file server, DNS server, Active Directory Domain Controller, or otherwise. Though many of these metrics are not immediately actionable, taken in aggregate, they provide a clear view of the state of the system at a point in time, which is invaluable when performing root cause analysis or troubleshooting. Of course, depending on your use case, there may be additional performance counters to monitor.
CPU metrics
| WMI Class | Property name | Description | Metric Type |
|---|---|---|---|
| Win32_PerfFormattedData_PerfOS_Processor | PercentProcessorTime | Percentage of time CPU is performing work | Resource: Utilization |
| Win32_PerfFormattedData_PerfProc_Thread | ContextSwitchesPersec | Number of times the processor switched to a new thread | Other |
| Win32_PerfFormattedData_PerfOS_System | ProcessorQueueLength | Number of threads waiting on a processor | Resource: Saturation |
| Win32_PerfFormattedData_PerfOS_Processor | DPCsQueuedPersec | Number of lower-priority tasks deferred due to interrupts | Resource: Saturation |
| Win32_PerfFormattedData_PerfOS_Processor | PercentPrivilegedTime PercentDPCTime PercentInterruptTime | Percentage of time CPU spent in privileged mode/deferred procedure calls/interrupts | Resource: Utilization |
PercentProcessorTime
Prolonged periods of 100 percent CPU usage indicates a resource bottleneck. Correlating CPU usage with the length of the processor queue can help you determine if your workload is too much for the machine. High CPU usage alongside spikes in processor queue length imply a lack of adequate compute resources for the operating system to complete the work it’s tasked with.
ContextSwitchesPersec
A context switch occurs when a processor has completed the execution of a task (or is interrupted before completion) and switches to a new one. A context switch is an expensive operation that involves the following steps, as outlined in Microsoft’s reference guide:
- Save the context of the just-completed thread
- Push the completed thread down to the end of the queue associated with its priority level
- Find the highest-priority queue containing executable threads
- Pop the thread at the head of that queue, load its context, and execute it
A high rate of context switching typically indicates resource contention and points to a CPU bottleneck. Though if the context switches are occurring due to some demanding hardware device (with a corresponding increase in the rate of interrupts), the problem could lie in its driver.
Microsoft offers a few tips here on optimizing workloads to minimize context switching, among other useful tidbits.
ProcessorQueueLength
Threads in the processor queue are ready to run but can’t, due to another thread running on the processor. Queues with sustained element counts greater than 2 are indicative of a bottleneck.
Keep in mind that queues are likely to increase in size during periods of high processor activity, but queues can also develop when utilization is well below 90 percent.
DPCsQueuedPersec
This post is part 1 of a 3-part series on monitoring the health and performance of the Windows operating system. Part 2 details how to monitor Windows Server 2012 natively with a variety of tools, and Part 3 explains how to monitor Windows with Datadog. For an in-depth webinar and Q&A session based on this series, check out this slide deck and video.
A window into Windows performance
Operating systems monitor resources continuously in order to effectively schedule processes. However, surfacing that data for your own monitoring or analytics is not always easy. Fortunately, the Windows Server family of operating systems offer a wealth of operational data that you can access through a number of channels. To help make your Windows infrastructure observable, you need to track several types of data from Windows Server 2012:
- Performance counters
- Events
- Services
A few notes about terminology: In this series, we use the term “Windows” to reference Windows Server 2012 R2 specifically, though many of the performance counters and events discussed in this series are available in other Windows Server versions. And we’ll characterize metrics as “work” or “resource” metrics—for background on this distinction, refer to our Monitoring 101 posts on metric collection and alerting.
Performance counters/metrics
Windows exposes a huge number of metrics (more than 15,000 on a fresh install) as so-called performance counters. Key performance counters can be divided into four groups:
- CPU
- Memory
- Disk
- Network
The lists provided below provide a good foundation to get started monitoring Windows Server, no matter if your box is a file server, DNS server, Active Directory Domain Controller, or otherwise. Though many of these metrics are not immediately actionable, taken in aggregate, they provide a clear view of the state of the system at a point in time, which is invaluable when performing root cause analysis or troubleshooting. Of course, depending on your use case, there may be additional performance counters to monitor.
CPU metrics
| WMI Class | Property name | Description | Metric Type |
|---|---|---|---|
| Win32_PerfFormattedData_PerfOS_Processor | PercentProcessorTime | Percentage of time CPU is performing work | Resource: Utilization |
| Win32_PerfFormattedData_PerfProc_Thread | ContextSwitchesPersec | Number of times the processor switched to a new thread | Other |
| Win32_PerfFormattedData_PerfOS_System | ProcessorQueueLength | Number of threads waiting on a processor | Resource: Saturation |
| Win32_PerfFormattedData_PerfOS_Processor | DPCsQueuedPersec | Number of lower-priority tasks deferred due to interrupts | Resource: Saturation |
| Win32_PerfFormattedData_PerfOS_Processor | PercentPrivilegedTime PercentDPCTime PercentInterruptTime | Percentage of time CPU spent in privileged mode/deferred procedure calls/interrupts | Resource: Utilization |
PercentProcessorTime
Prolonged periods of 100 percent CPU usage indicates a resource bottleneck. Correlating CPU usage with the length of the processor queue can help you determine if your workload is too much for the machine. High CPU usage alongside spikes in processor queue length imply a lack of adequate compute resources for the operating system to complete the work it’s tasked with.
ContextSwitchesPersec
A context switch occurs when a processor has completed the execution of a task (or is interrupted before completion) and switches to a new one. A context switch is an expensive operation that involves the following steps, as outlined in Microsoft’s reference guide:
- Save the context of the just-completed thread
- Push the completed thread down to the end of the queue associated with its priority level
- Find the highest-priority queue containing executable threads
- Pop the thread at the head of that queue, load its context, and execute it
A high rate of context switching typically indicates resource contention and points to a CPU bottleneck. Though if the context switches are occurring due to some demanding hardware device (with a corresponding increase in the rate of interrupts), the problem could lie in its driver.
Microsoft offers a few tips here on optimizing workloads to minimize context switching, among other useful tidbits.
ProcessorQueueLength
Threads in the processor queue are ready to run but can’t, due to another thread running on the processor. Queues with sustained element counts greater than 2 are indicative of a bottleneck.
Keep in mind that queues are likely to increase in size during periods of high processor activity, but queues can also develop when utilization is well below 90 percent.
DPCsQueuedPersec
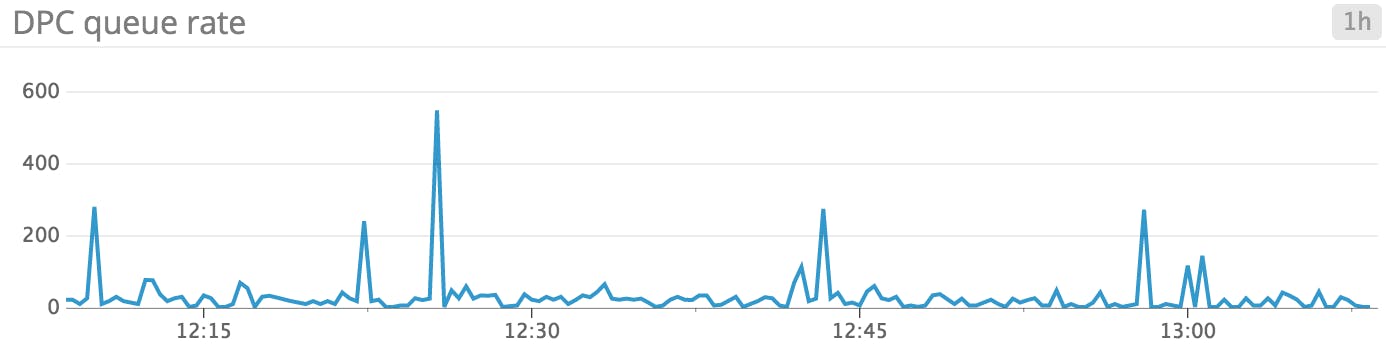
Deferred procedure calls (DPCs) provide a low-priority interrupt mechanism on Windows systems. Understanding deferred procedure calls requires a brief explanation of system interrupts in an operating system context.
Hardware requirements demand real-time, unfettered access to the CPU in order to ensure that high-priority work (like accepting keyboard input) is performed when it is needed. Interrupts provide a means by which devices can interrupt the processor and force it to perform the requested operation (triggering the processor to perform a context switch). Some work from devices may be put off until later, but still must be accomplished in a timely manner. Enter DPCs.
Through DPCs, real-time processes like device drivers can schedule lower-priority tasks to be completed after higher-priority interrupts are handled. DPCs are created by the kernel, and can only be called by kernel mode programs.
A high or near-constant number of DPCs could point to issues with low-level system software. An unused but buggy sound driver could be the culprit, for example. For more information on finding the offending service or program, check out part two of this series.
PercentPrivilegedTime, PercentDPCTime, and PercentInterruptTime
This trio of percentages offers insight into high CPU usage. PrivilegedTime is the time the CPU spends processing instructions from kernel-mode programs, DPCTime is the time the CPU spends processing deferred procedure calls, and InterruptTime is the time the CPU spends handling interrupts. It should be noted that the processor regularly issues interrupts to switch context to a new thread, so you should expect some level of background noise for this metric.
Systems that are spending 30 percent or more of their time processing privileged instructions should be inspected. First, examine DPCTime and InterruptTime; if either value exceeds 20 percent, a hardware issue is likely to be the culprit. You can use a tool like xperf (bundled with Windows) to dig deeper into the offending process.
Memory metrics
| WMI Class | Property name | Description | Metric Type |
|---|---|---|---|
| Win32_PerfFormattedData_PerfOS_Memory | AvailableMBytes | Amount of physical memory available (MB) | Resource: Utilization |
| Win32_PerfFormattedData_PerfOS_Memory | CommittedBytes | Amount of virtual memory (in bytes) committed | Resource: Utilization |
| Win32_PerfFormattedData_PerfOS_Memory | PoolNonpagedBytes | Amount of memory (in bytes) excluded from the paging pool | Resource: Utilization |
| Win32_PerfFormattedData_PerfOS_Memory | PageFaultsPersec | Page faults per second | Resource: Saturation |
| Win32_PerfFormattedData_PerfOS_Memory | PagesInputPersec | Number of pages retrieved from disk (per second) | Other |
| Win32_PerfFormattedData_PerfOS_PagingFile | PercentUsage | Percent of paging file used | Resource: Utilization |
AvailableMBytes
It is important to keep an eye on the amount of available memory, as contention for RAM will inevitably lead to paging and performance degradation. To keep your machine humming along, make sure it has an ample amount of RAM for your workloads. Consistently low memory availability can lead to segmentation faults and other serious issues. Possible remedies include increasing the amount of physical memory in the system and, if appropriate, enabling memory page combining.
CommittedBytes
CommittedBytes represents the actual demand for virtual memory. Memory that has been allocated, whether in physical RAM or the page file, counts towards the CommittedBytes total. When the number of CommittedBytes approaches or exceeds the physical memory of the system, paging to disk (and its associated performance impacts) is unavoidable.
If the value of CommittedBytes converges on the maximum memory of the system, then you are running out of available memory and must either increase the size of the page file or increase the amount of physical memory available.
In general, if this metric is trending upward increasing without leveling off, you should investigate.
PageFaultsPersec
Page faults occur when a process requests a page in memory that can’t be found. There are two types of page faults: soft and hard. A soft page faultindicates that the page was found elsewhere in memory. A hard page faultindicates that the page had to be retrieved from disk. Systems can tolerate a fairly high number of soft page faults, though hard page faults often result in delays.
The PageFaultsPersec metric tracks the number of page faults, both soft and hard. To focus on hard page faults, look for high values of pages input per second (outlined below). If you identify a surge in hard page faults, you should either increase system memory, or else decrease the system cache size to free up memory for paging.
Monitoring the working set of process memory allows you to correlate a specific process’s memory usage with page faulting. Under heavy load, the operating system will continuously trim processes’ working memory, resulting in frequent page faults. To narrow down the offending process, you can also correlate with page fault frequency by process (check the Win32_PerfFormattedData_PerfProc_Process object).
PoolNonpagedBytes
As mentioned above, the Windows kernel and hardware devices require the ability to preempt other threads to execute their time-sensitive work. Because of these strict requirements, devices and the kernel access physical memory directly, and not through virtual memory, as do user-mode processes.
This special pool of memory is not subject to paging to disk, due to the time requirements of its users. Normally, this is not an issue. But the special treatment of this pool means that problems with the components using this memory could be fatal for the system. Memory leaks in drivers that use the non-paged pool, for instance, could lock up the system entirely, as memory for user-mode processes is dumped to disk. Keeping an eye on this metric is useful for debugging memory leaks and other showstopping issues.
Windows Event 2019 (“Nonpaged Memory Pool Empty”) will occur in the event of insufficient allocable memory. (Though the Microsoft reference page lists the cause as a TCP/IP sockets program continuously attempting to open a nonexistent socket, this event will also occur if the non-paged pool address space is exhausted.)
PagesInputPersec
This metric reports the number of pages read from disk (as opposed to the number of read operations) to resolve hard page faults.
Recall that there are two types of page faults, and only hard page faults require fetching the page from disk. Tracking PagesInputPersec alongside PageFaultsPersec gives a clear view into the type of fault occurring. High values of the PagesInputPersec counter indicate hard page faults.
It is worth mentioning that when a hard page fault does occur, Windows attempts to retrieve multiple, contiguous pages into memory, to maximize the work performed by each read. This, in turn, can potentially increase a page fault’s performance impact, as more disk bandwidth is consumed reading in potentially unneeded pages. All of this can potentially be avoided by putting your page file (see next section) on a separate physical (not logical) disk, or increasing the amount of RAM available to your system.
PercentUsage
The paging file is a “hidden” file in the Windows system folder, used to store infrequently accessed memory pages on disk to free up RAM for other things. If you are familiar with Linux, the page file is similar to the swap partition.
Because the paging file is located on disk, not only will reads/writes to it impact overall system performance, but it is also subject to fragmentation, which degrades system performance even further.
By default, Windows manages the page file, which means the size of the file can increase or decrease without any user input. However, some cases may warrant manual tweaking of the file size. For more information on tuning your page file size (and other potential optimizations), check out Microsoft’s documentation on page file tuning.
Disk metrics
| WMI Class | Property name | Description | Metric Type |
|---|---|---|---|
| Win32_PerfFormattedData_PerfDisk_LogicalDisk | PercentFreeSpace | Percentage of disk space remaining | Resource: Utilization |
| Win32_PerfFormattedData_PerfDisk_LogicalDisk | PercentIdleTime | Percentage of time disk was idle | Resource: Availability |
| Win32_PerfFormattedData_PerfDisk_LogicalDisk | AvgDisksecPerRead AvgDisksecPerWrite | Average time of a read/write operation (in seconds) | Work: Performance |
| Win32_PerfFormattedData_PerfDisk_LogicalDisk | AvgDiskQueueLength | Average number of read/write requests (per disk) in queue | Resource: Saturation |
| Win32_PerfFormattedData_PerfDisk_LogicalDisk | DiskTransfersPersec | Rate of read/write operations on disk | Work: Throughput |
| Win32_PerfFormattedData_PerfOS_Memory | CacheBytes | Size of file system cache in memory | Resource: Utilization |
PercentFreeSpace
Maintaining ample free disk space is a necessity for any operating system. Beyond regular processes requiring disk, core system processes store logs and other kinds of data on disk. Windows will issue a warning if your available disk space drops below 15 percent, but you should alert on this metric to catch the smoke before the fire.
PercentIdleTime
This metric reports the percentage of time the disk was idle. If you are hosting your page file on a drive separate from the OS drive, you should definitelytrack and potentially alert on this metric, on both your primary drive and the page file’s drive. Low values for idle time should be investigated; high I/O on the page file disk will translate to increased memory access times, which will be felt by any application whose memory is mapped to the paging file. Possible solutions include moving the paging file to an unused drive or a faster drive.
Beyond the paging file, performance of applications that make heavy use of the disk (like SQL Server, for example) will certainly suffer during prolonged periods of high I/O.
AvgDisksecPerRead and AvgDisksecPerWrite
This pair of metrics tracks the average amount of time taken for disk read/write operations. In general, values larger than about 30 milliseconds indicate relatively high latency, which can often be reduced by moving to faster disks. Depending on the role of your server, the acceptable threshold could be much lower—as low as 10 milliseconds if you are running Exchange Server or SQL Server.
AvgDiskQueueLength
The average disk queue length gives a running average of the number of read/write requests in the queue. This value is not a direct measurement of the disk queue at any given point in time; it is an estimate derived from (Disk Transfers/sec) * (Disk secs/Transfer).
monitoring windows server 2012 cheat sheet, monitoring windows server 2012 nagios, monitoring windows server 2012 with scom 2007 r2
Source: http://docphy.com/technology/computers/computer-servers/monitoring-windows-server-2012.html

No comments:
Post a Comment